
View the overall results of your Google Ads campaigns? It's easy! But to really improve your results, it's crucial to analyze in detail the<s performance of each of your campaigns, ads, targets and keywords. To do this, the Google Ads reporting interface offers hundreds of KPIs (key performance indicators) enabling you to track the effectiveness of your campaigns and make informed decisions to optimize them.
Perhaps you've heard of terms like conversion rate, customer acquisition cost or ROAS, but don't really know what they mean?
In this article, we'll show you how to understand and interpret the various Google Ads KPIs, giving you concrete examples of how to use them for e-commerce and lead generation sites.
Overview of Google Ads KPI columns
First of all, the most obvious question: Where can I find the menu with all the available KPIs?
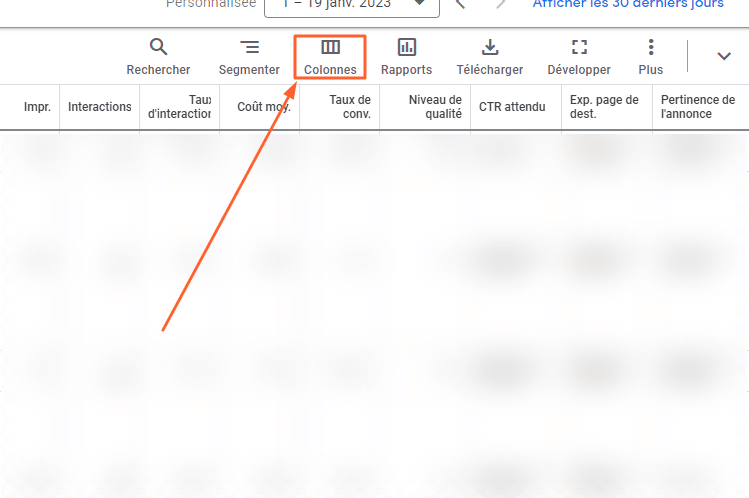
To do this, go to your Google Ads account, to your campaigns, and click on the small "Columns" logo at the top right of the reporting table. This will give you access to the entire library of analysis metrics offered by Google Ads.
The first thing we notice is the existence of a KPI classification:
- Some, for example, will belong to the "conversion"In other words, they'll give you information about your site's ability to convert visitors to Google Ads into leads or customers.
- Others will be classified in the "performance" tab, which measures attractiveness of your ads.
- There is also a third category of KPIs relating to the visibility of your ads
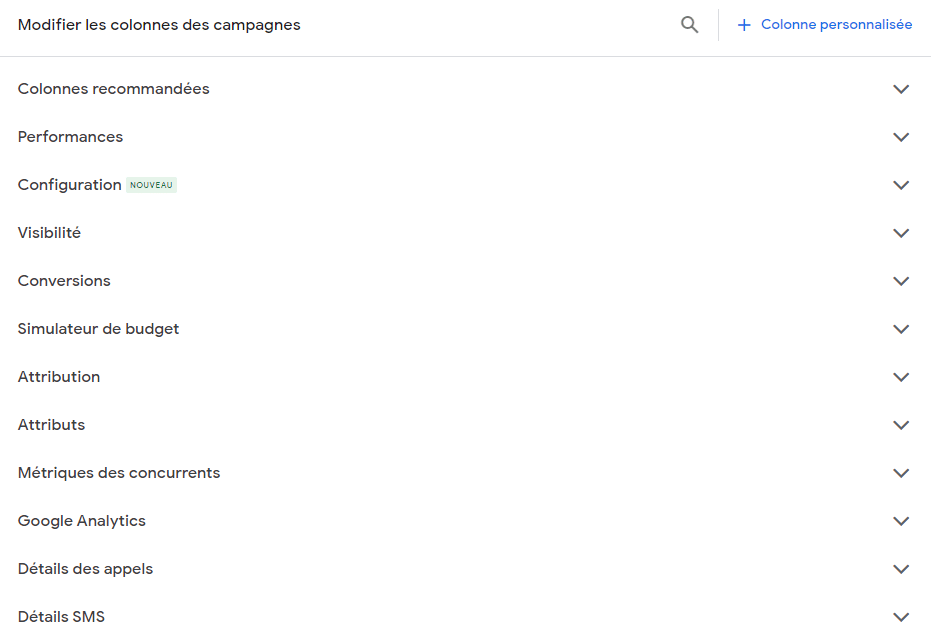
There are still other categories for more nested needs (call details, Gmail metrics, Google Analytics, etc.) that we won't go into in detail in this article, but which you can find in the Google documentation on the subject.
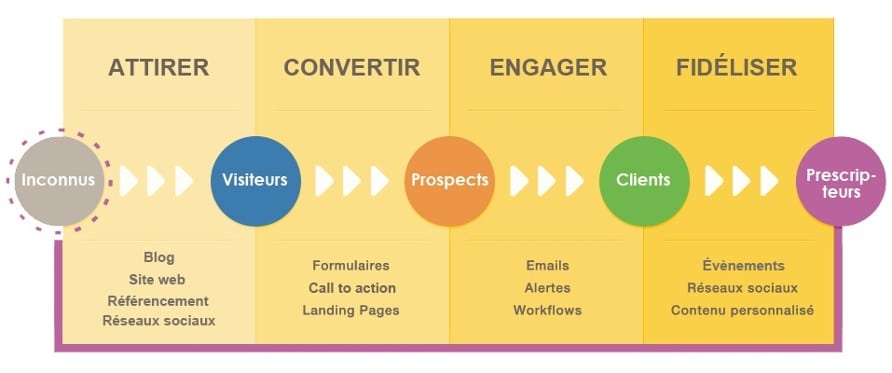
Anecdote: This classification is no coincidence: it broadly reflects all the stages of the classic marketing conversion funnel (Visibility > Engagement > Conversion > Loyalty), which are generally tracked using CRM.
Basic KPIs in Google Ads
Right, so let's get down to the nitty-gritty of Google Ads performance indicators.
First of all, to present the most basic, we have :
- Impressions: the number of times your ad is seen.
- Clicks: the number of times users click on your ad.
- Cost: this is the total amount spent for all interactions with the ads in your campaign.
As a reminder: Google is a PPC (Pay Per Click) system, meaning that you only pay when someone clicks on your ads. Impressions themselves cost nothing. Note, however, that there are exceptions (of necessity!), and we'll come back to these later.
So okay, we have impressions (views) which are a source of clicks which will generate a cost. Dividing the total cost by the number of clicks gives us the price of an average click.
This KPI is called the CPC (cost per click).
Ideally, you want to have the lowest possible cost per click, but Google Ads works on a bidding system, so the more people decide to bid on a single keyword, the more its CPC will increase, leaving position 1 in the results to the highest bidder.
We've just seen what happens when you put clicks and costs together.
It's just as interesting to do the same thing, but this time with clicks and impressions.
Why? Because it gives us an idea of whether our ad is likely to get clicked or ignored.
The CTR (click-through rate) is the ratio [Total clicks] / [Total impressions] x 100, i.e. "how many percent of people who saw my ad clicked on it".
For those of you who might be wondering: "What's a good CTR?" (because that's a question that comes up a lot).
There's no right answer: it depends on a whole host of criteria, such as sector, level of competition and how relevant you are to the user's query.
For example: a CTR of 20% would be considered really good for the generic query "Unfair competition lawyer", whereas it would be really bad if the query was "Contact Maître Moya" (and you were Maître Moya in person).
KPIs that are a little more advanced (but worth knowing)
Quality score
Let's start with the quality score. The quality score measures the relevance and quality of your Google ads and the landing pages to which users are sent. It's made up of 3 elements:
Ad relevance: The more relevant your ads, the higher your quality score.
Landing page relevance: The more relevant the landing page is to the ad, the higher your quality score will be.
Expected CTR: If Google expects your ad to get lots of clicks, your score will be high.
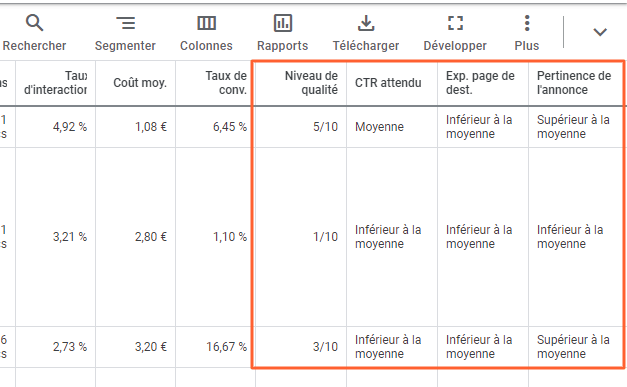
There's also a "Quality level" column, which assigns a score from 1 to 10 to each of your keywords according to these three criteria. The idea is to get as close to 10 as possible, as the quality score has an impact on your CPC. In fact, the lower the score, the more "noise" your ad is to Google's users. In addition to making as much money as possible, Google also wants to provide its users with quality content. So it's only logical that the quality score should come into play in calculating the page's position in the search results. So an advertiser who bids €3 on a keyword, for example, may end up behind another advertiser who bids €2.5 on the same keyword. It's miraculous to be higher in the results for less money, isn't it? The quality score is therefore a very interesting KPI to monitor in order to optimize the performance of your campaigns.
Don't forget, the "Quality Level" remains a grouping of 3 components that can be displayed individually to understand what needs to be optimized first.
These 3 indicators can also be found in the column menu under :
- CTR Expected
- Ship to page
- Relevance of the ad
Conversion rate and conversion cost
We'll talk later about the subtleties between e-commerce and lead generation sites, but what these two families of sites have in common with Google Ads is that they're looking for conversions.
A conversion in Google is a key action for your business. It can be a purchase, but also a form submission, an ebook download, a phone call... Whatever you want.
When we cross-reference the number of conversions with the number of clicks, we know how many conversions take place on average per 100 clicks. This is the conversion rate.
For the die-hards who might be asking the question: "What's a good conversion rate anyway?" (because that one comes up a lot too).
I refer you to the same answer given a few lines above to the question "What is a good click-through rate (CTR)?
Similarly, when we divide the total cost by the number of conversions, we obtain an average cost per conversion. This is the "cost per acquisition", the famous CPA of Google Ads.
Print rate
The impression rate allows you to identify which ads are likely to reach more users if you increase your bid or your budget.
It measures the number of actual impressions against the potential number of impressions. It is influenced by the approval, quality, targeting and bidding of your ads and is updated daily. Understand: how many times your ad appears in results for the number of impressions you should have with your targeting and bidding level.
There's a variant called "Impression rate in 1st position", but there's a catch! By 1st position Google means "anywhere above the natural search results", which is not quite the same thing 😉
If you really want to look at your Print Rate in position 1, then prefer "Print Rate in absolute 1st position".
If you make video : Views and CPV
The view rate measures the proportion of people who have started viewing your video in relation to the total number of people who have seen your ad. Note that there are different types of view rate, such as full view rate, start of video view rate, 30-second view rate, and so on.
You may recall that at the start of this article I said that Google operated on a PPC (Pay Per Click) model, with a few rare exceptions...
Video campaigns on YouTube Ads (managed from Google Ads) are just one example.
Typically, this type of campaign is billed on a cost-per-view (CPV) basis.
What is a view again?
A view is counted when the viewer watches the video for 30 seconds or until the end (whichever comes first). Interaction with the ad can also increase the number of views.
CPV is the average price per view obtained by dividing the cost of the campaign by the number of views.
This type of bidding is generally well suited to video campaigns on YouTube, for example.
Common e-commerce KPIs
It's not an absolute truth, but in most cases there are two types of Google Ads account. E-commerce accounts and leadgen accounts.
In the case of an e-commerce account, the main objective will be to maximize the "conversion value", which generally corresponds to the sales generated by Google Ads campaigns on the site.
However, the value of conversions alone is not necessarily viable in the long term. You need to be able to cross-reference this value with the cost of Google Ads campaigns for a complete analysis of the profitability of operations.
ROAS (Return on Ad Spend) is a KPI that measures the return on investment (ROI) of campaigns. It is calculated by dividing the conversion value generated by your Google Ads campaigns by the amount spent on these campaigns.
I'm deliberately emphasizing "the conversion value generated by your Google Ads campaigns", because we're talking about sales generated by Google Ads alone, in relation to Google Ads spending. Not the overall sales of the site, let alone the company.
Two tips that might interest you if you are an e-tailer:
- You can create an "average basket" column by clicking on the "+Customized column" button at the top right of the main column menu. Then divide the conversion value by the conversion volume.

- Currently in Beta, Average Cart Size is a statistic that measures how many products customers buy on average when placing an order. It is calculated by dividing the total number of products sold by the total number of orders.

KPIs frequently used in lead generation.
In the overwhelming majority of cases (and sometimes wrongly), lead generation sites are used to optimizing their campaigns according to CPA. In their case, the conversion is the generation of a contact form (for example), so their cost per lead (CPL) on Google Ads is equal to their CPA (Cost per Acquisition).
The problem is that a prospect is not necessarily a customer. So it's not fair to take the shortcut "I get a customer every X€", X being equal to the CPA.
In this case, the analysis doesn't go far enough, and doesn't offer the opportunity to compare advertising expenditure with campaign ROI.
To alleviate this problem, setting up a CRM to measure offline conversions by users is the best solution. We have written a detailed article on this subject, which you can find here : Measure offline conversions with CRM.